I have had a chance to think about the first launch yesterday and sleep on what I learned. I decided it would be best to write up the complete process of how the tracking of the balloon was completed, and what I’m planning to do to improve it for my specific requirements.
The first step was to install the D-MET software onto my laptop, so that it can interface with the tracking station which picks up the signals from the radiosonde. The software was installed from a USB and it was the latest version, which was better and more advanced than what the SA weather bureau was running to predict the weather for the entire country!
Once the software was installed, it was time to set it up to my requirements. Firstly, I had to tell it which ground station I would be using. The portable tracking unit is called the iMet-3050A, so I selected that option and moved onto the second step. This was just customizing the interface and warning sounds and stating whether I used metric or imperial units. Selecting metric, I moved on to the next part of the setup, which was the operational preferences. This involved choosing where to store the tracking data on my laptop, as well as how the name should be formatted. The next stage was crucial. Still inside the operational preferences, I had to navigate to the automatic events deselect everything that would cause an automatic termination of the tracking sequence. I wanted it to keep tracking the radiosonde, even if it wasn’t receiving a signal.
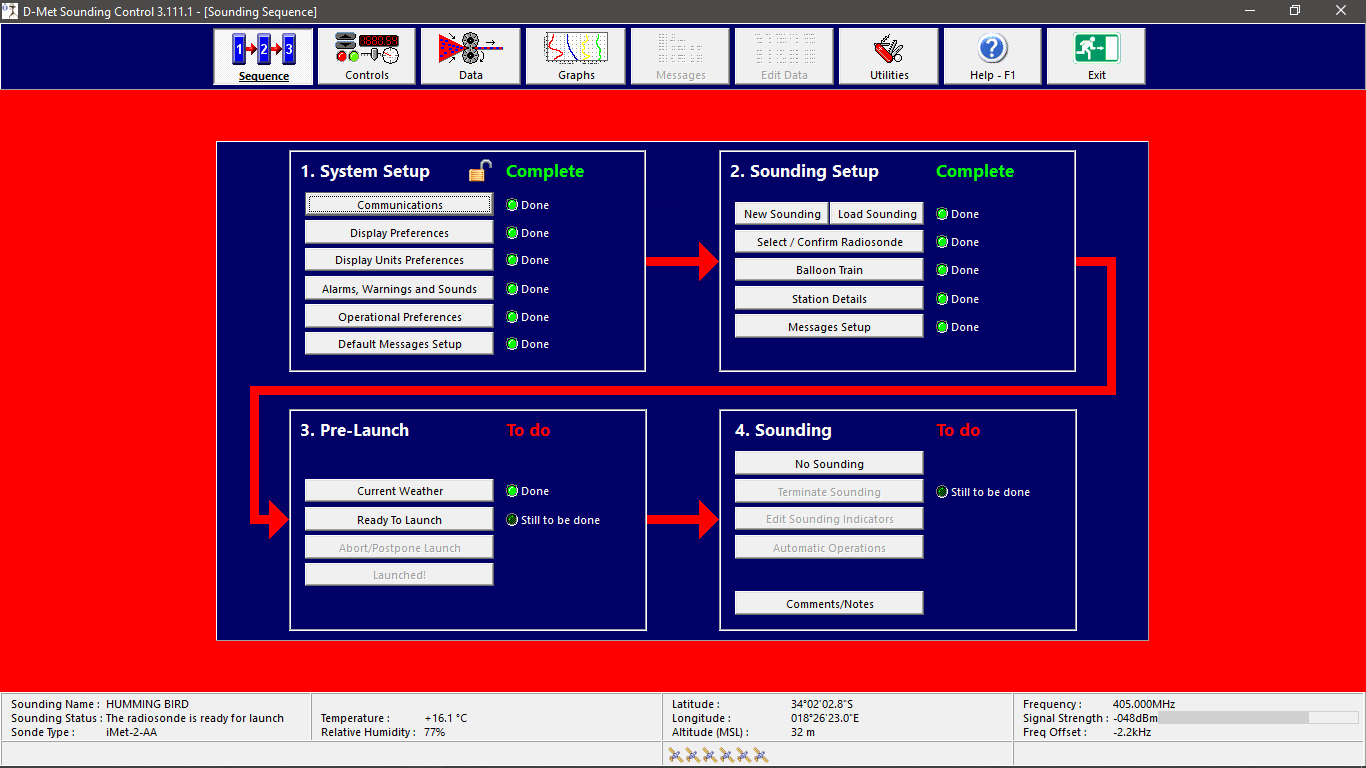
The second stage was setting up the tracking sequence. Where the previous stage had been focusing on the ground station and the fundamentals, this stage was on the radiosonde and more variable conditions. I had to create a new name for the tracking data (or sounding name as they like to call it), followed by what radiosonde I was using. The radiosondes used are quite variable as they are testing new ones all the time. I used one of the latest versions, which was the iMet-54-AB, so I selected that and moved on. I then had to set up the station details, what its starting location was, who the operator was (which was me), and what the station name was.
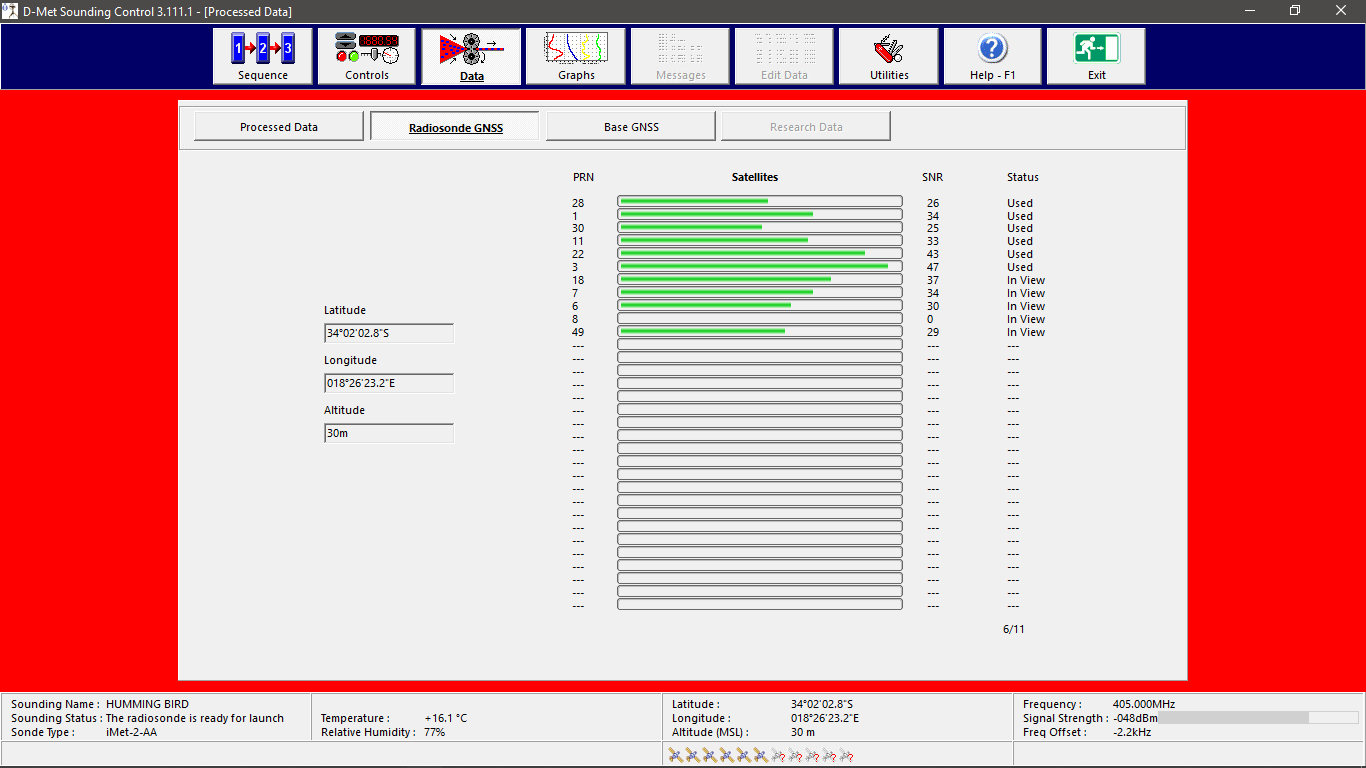
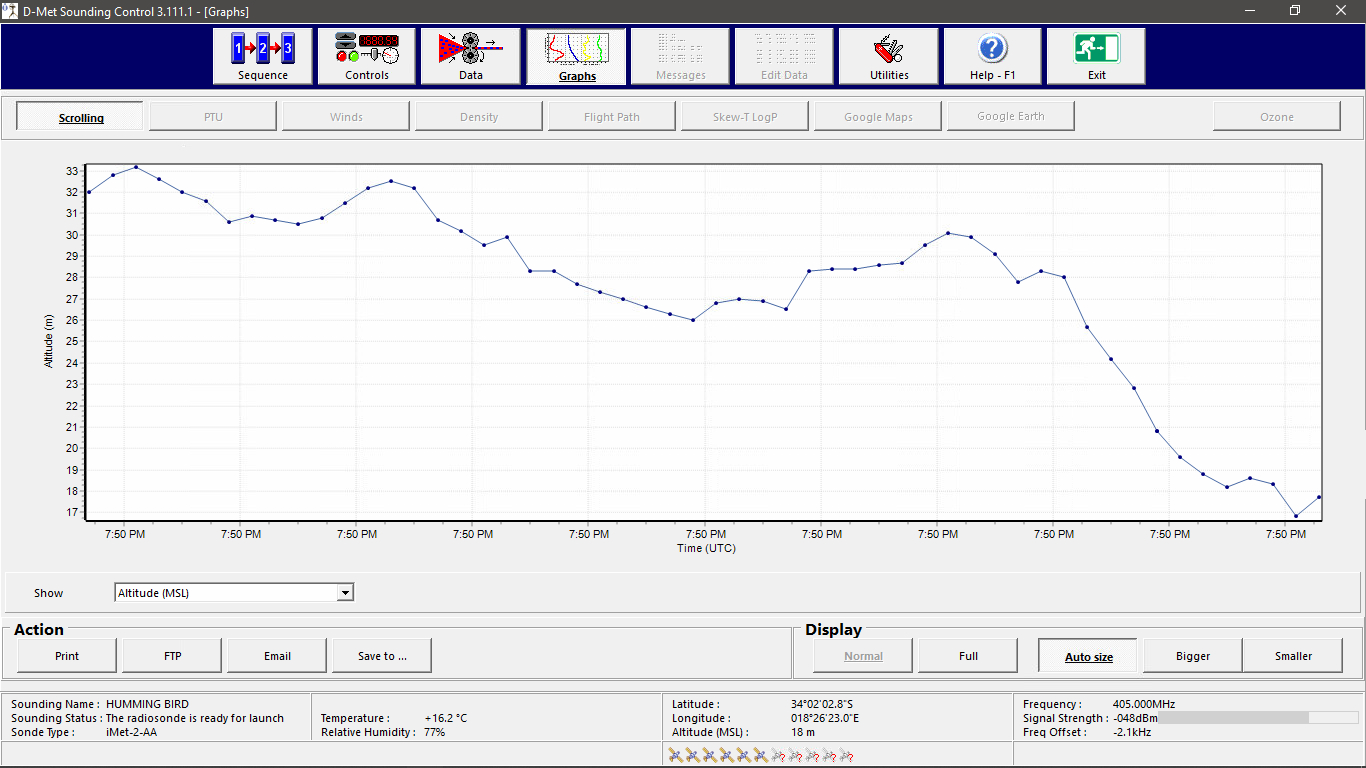
Once that stage was done, it was time to launch. With the portable tracking station plugged into the laptop, I just had to do one more setup, which was the base weather conditions (such as air temperature, humidity, barometer-level pressure and a few other things so that the radiosonde has something to compare to). With that done, I clicked the launch button and then magic happened. Suddenly I was receiving tons of data from the weather balloon that we had launched about an hour earlier, such as its latitude, longitude, altitude, how fast it was traveling, in what direction it was moving, how many satellites it was connected to, and a whole lot more.
In order to get a better signal, we went onto the roof of Intermet and sat there monitoring the balloon as it ascended and then descended. Michel showed me that the software wrote to a DAT file every second, with the latitude, longitude and altitude, as well as a bunch of other things that were unnecessary for my requirements. The DAT file was basically just another extension that contained a CSV file. A CSV file is a basic database table with rows and columns, but in text format, so the rows are separated by a line break, while the columns are separated by a comma. This is why it is named Comma Separated Values, or CSV for short. Because it is a text database, it is easy to read the file from another application such as Excel and see the exact position of the radiosonde in a nice interface. However, Excel cannot update the file every second, which is what was happening with the DAT file.
This got me thinking: since it is a basic database, I could write a piece of code that would read the defined column number for the latitude, longitude and altitude, and would write just those values to a KML every second. (A KML is a Google Earth file that can draw paths and polygons over 3D satellite terrain, which is ideal for tracking a weather balloon in 3 dimensions and having a graphical interface to see exactly where it is). Once the piece of code has finished reading the values from the DAT file, and has written them to the KML, the process would repeat itself every second and so the route in Google Earth would be updated in real time. Of course this is all theoretical, however I believe it can be done.
When the radiosonde had fallen behind the mountains on the horizon, we lost track of them as the signal was not strong enough to penetrate the mountain. With that the tracking sequence was terminated and I had my first real data to experiment with. When I installed the software, Michael didn’t think it would be able to track past the balloon burst, as they had never done it before, but the software handled it perfectly and it was a big success.
The next step will be to write that piece of code and see if Google Earth can handle the real time updates and draw a 3D path of where the balloon is and what it’s route was. I am also thinking of writing another piece of code that will try to predict the landing point based on the wind direction and speed, as well as the balloon’s ascent rate, predicted burst altitude based on current barometric pressures and how heavy the payload is, as well as how much Hydrogen was put into the balloon. However this is much more advanced, and I think I will first see if the first option works before I move onto anything fancier.
After seeing how fast the payload dropped for this test, it became apparent that the parachute might not be all that reliable, so I think it will be a good idea to build my own custom housing for the cameras and add extra cushioning to be safe. I will need to see if there are any polystyrene manufacturers in Cape Town who could build the housing if I came up with the design. I will start designing it tomorrow, but today I rest.


